Exact resonance states of H₂⁺, against the Born–Oppenheimer picture¶
The Born–Oppenheimer (BO) picture assigns every dissociative-recombination (DR)
peak to a quasi-bound level \(\omega_i^j\) — vibrational level i of Rydberg curve
j. This note drops that approximation. It reports the poles of the full 2-D
S-matrix for the H₂⁺ model, compares them to the BO levels they are supposed
to be, and checks both against a previously computed σ_DR sweep of the same
model that neither was fitted to.
Three results come out of it, and the third was not anticipated:
The exact poles reproduce the published peak positions to within a third of a resonance width. The BO levels degrade steadily across the three energy windows — the BO error, measured against data.
The size of the BO error sorts by regime, not by level index: a thirteenfold split between diffuse high-
nRydberg states and compact low-nones.Four of the 57 poles are not resonances at all. They passed the two-angle ECS stability test that found them, which is the point — stability is necessary and not sufficient.
Companion notes: h2plus-dr.md for the σ_DR solver itself and its open
defects, exact-2d-resonances.md for the method and its N₂ application,
lcp-resonance-levels.md for the BO levels this is measured against.
The result¶
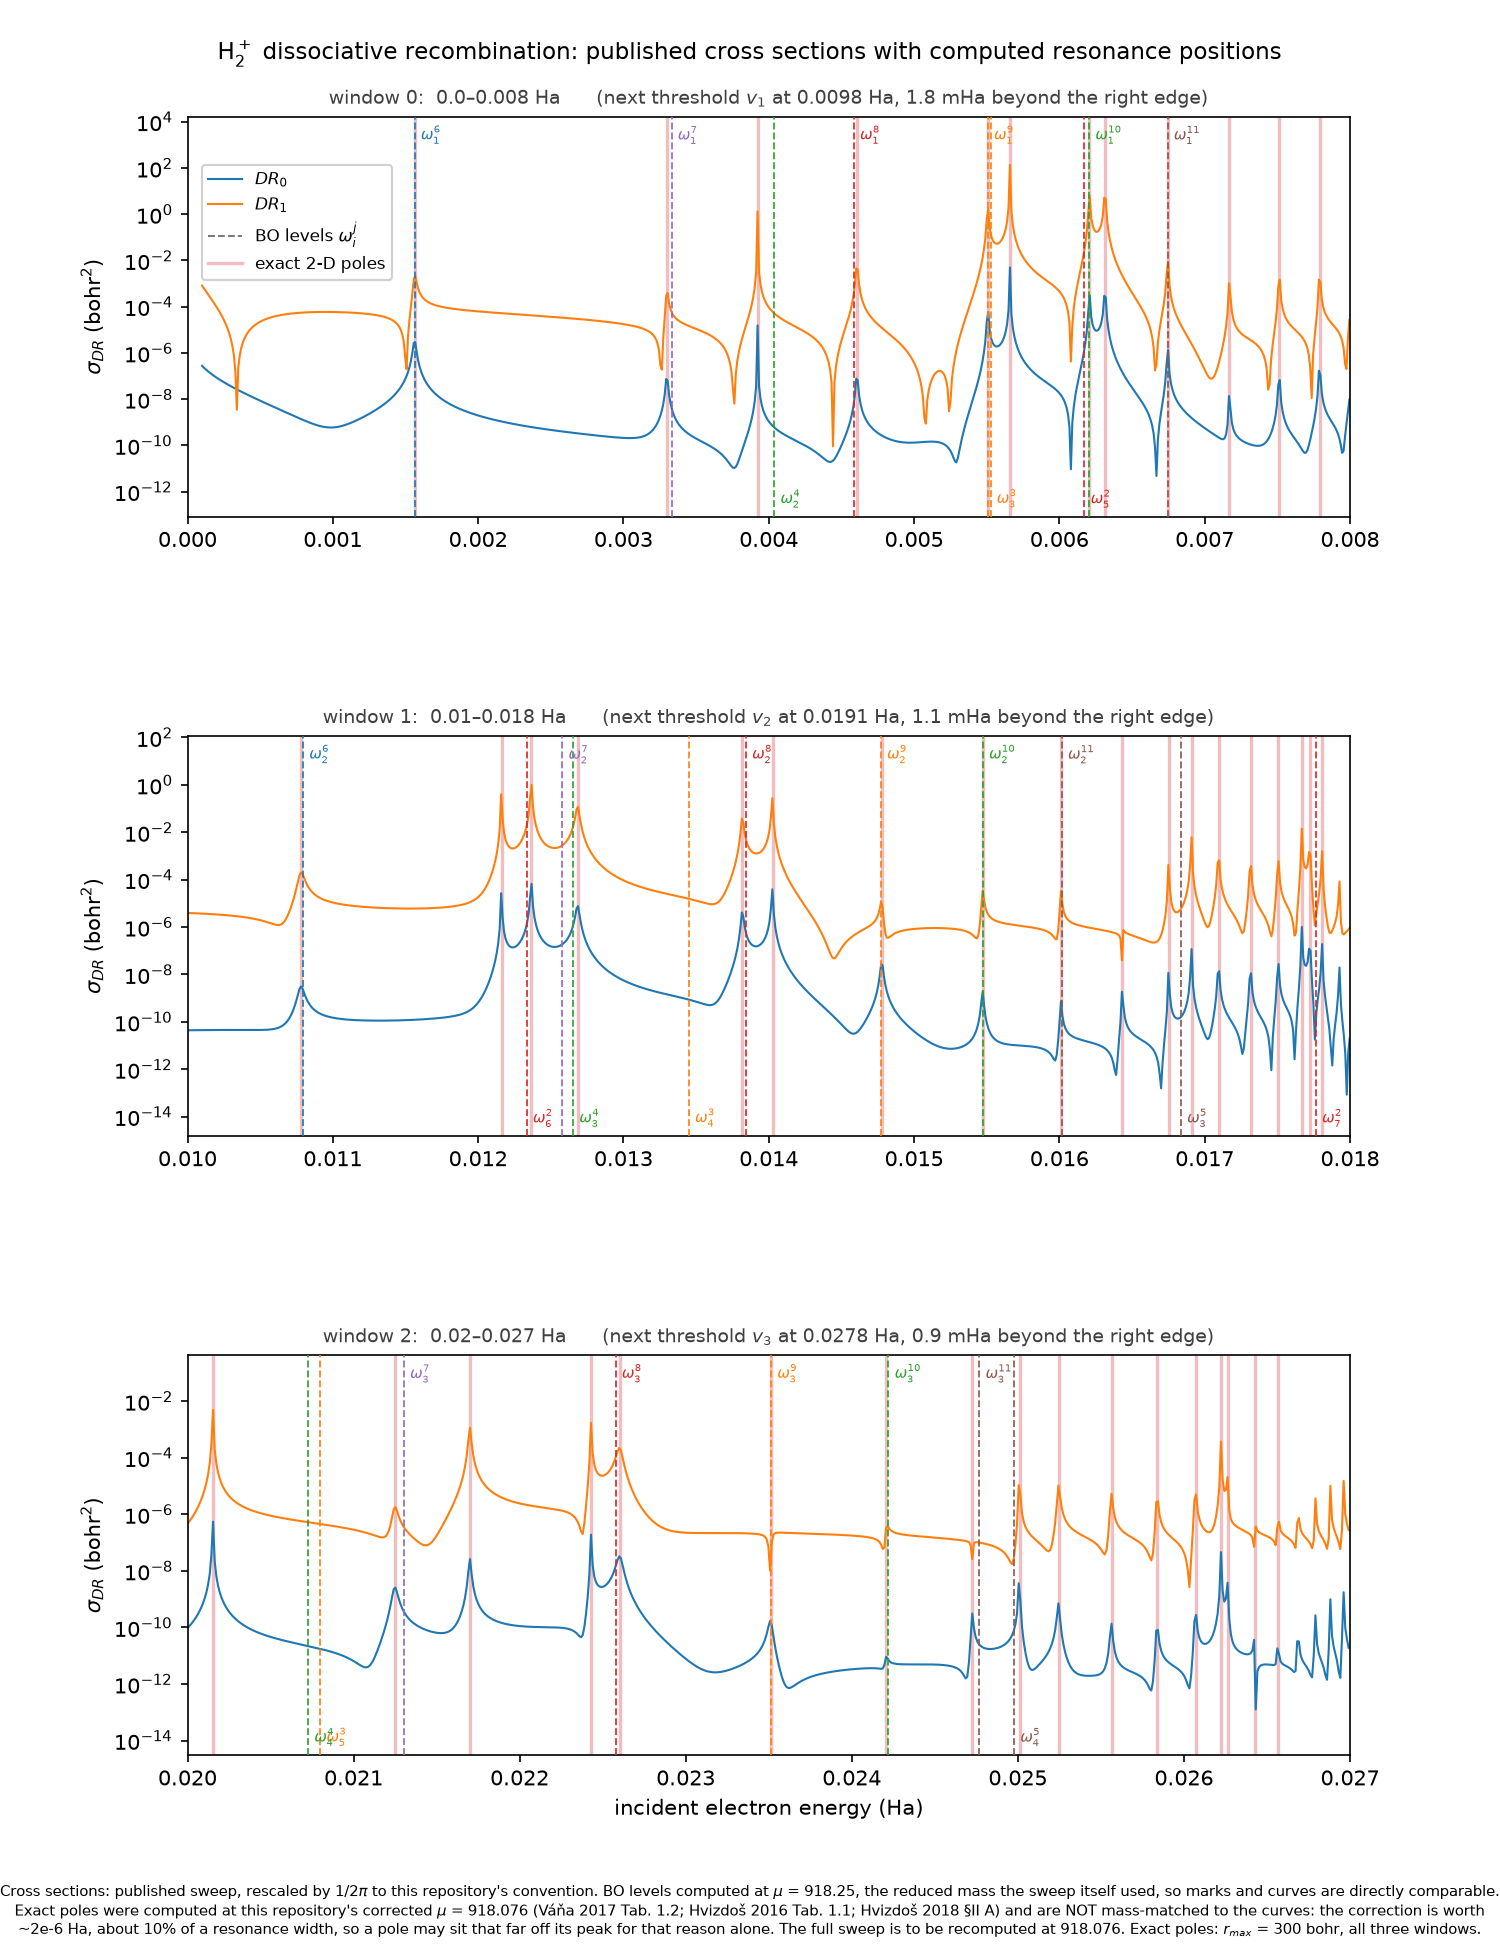
The previously computed σ_DR(E) sweep across the three published energy windows, with the BO levels \(\omega_i^j\) (dashed, labelled) and the exact 2-D poles (solid, lighter, drawn beneath) marked on it. Levels computed at \(\mu = 918.25\), the reduced mass the sweep itself used — see Reduced mass below.
Distances to the nearest peak in the sweep, in units of a resonance width (median FWHM 2 × 10⁻⁵ Ha — the only scale on which “lands on the peak” means anything), with the count landing inside one width:
series |
window 0 |
window 1 |
window 2 |
|---|---|---|---|
exact 2-D poles |
0.2 (11/12) |
0.2 (14/18) |
0.3 (9/17) |
BO levels |
0.8 (5/9) |
3.7 (2/11) |
30.4 (0/8) |
All three windows agree. The BO row degrades monotonically across them, which is what a growing non-adiabatic error looks like when you have data to measure it against.
Both rows reached those numbers by correction, and the route matters, because
each intermediate value was wrong in a way that looked like physics. The BO
row once read 1.8 / 8.2 / 15.5, measured against a level set truncated to three
or four marks per window by an electronic box too small to hold Ry₅₊ — and the
missing levels were exactly the ones sitting on the lower-window peaks. The
pole row’s window 2 once read 13.9 widths, then 3.3, now 0.3: the first drop
from seeding the campaign at every BO level instead of three per window, the
second from deleting the four states that are not resonances. There is no
window-2 anomaly. Two explanations were offered for it along the way —
threshold proximity, then residual under-seeding — and neither survived.
Four of the poles are not resonances¶
Energy proximity cannot distinguish a resonance from a rotated-continuum eigenvalue that lands nearby: both are just numbers on the same axis. Overlap can. A genuine resonance is a BO product plus a correction, so it overlaps ONE reference state strongly and the rest weakly, with matching node counts; a discretized-continuum state rotated onto the real axis overlaps everything weakly and nothing strongly.
This is also how the published work assigns a cross-section feature to a quasi-bound state (Váňa 2017, Table 4.2, p. 73), so the same quantity answers both the assignment question and the prior question of whether there is anything there to assign.
Measured on window 0 the two classes separate by three orders of magnitude:
E (Ha) |
best BO |
overlap |
second |
reading |
|---|---|---|---|---|
0.001563 |
\(\omega_1^6\) |
0.9870 |
\(\omega_2^4\) 0.10 |
genuine; too narrow to show a peak |
0.003924 |
\(\omega_2^4\) |
0.8777 |
\(\omega_3^3\) 0.33 |
genuine, mixed |
0.004479 |
\(\omega_5^2\) |
0.0006 |
0.0001 |
not a resonance |
0.004607 |
\(\omega_1^8\) |
0.9769 |
\(\omega_2^4\) 0.14 |
genuine |
0.005661 |
\(\omega_3^3\) |
0.7831 |
\(\omega_5^2\) 0.46 |
genuine, strongly mixed |
0.006316 |
\(\omega_5^2\) |
0.8700 |
\(\omega_3^3\) 0.44 |
genuine, strongly mixed |
0.007171 |
\(\omega_1^{12}\) |
0.9901 |
\(\omega_2^5\) 0.07 |
genuine |
0.008180 |
\(\omega_1^{16}\) |
0.6828 |
\(\omega_2^5\) 0.65 |
genuine, maximally mixed |
0.008260 |
\(\omega_1^{16}\) |
0.7252 |
\(\omega_2^5\) 0.60 |
genuine, maximally mixed |
Across all three windows, of 57 poles: 24 pair cleanly, 18 are box-limited (below), 3 are near-equal blends of two BO levels, 6 have their partner outside the enumerated basis, 2 are weak, and 4 are not resonances (E = 0.004479, 0.021782, 0.022796, 0.026065; best overlaps 6 × 10⁻⁴ to 7 × 10⁻³).
Removing those four is what makes window 2 agree with the others: 13.9 → 3.3 → 0.3 widths. One of them sat 0.4 widths from a peak by coincidence and was flattering the figure; the other three sat 6–32 widths away and were spoiling it. Running the check was worth it in both directions.
The basis has to be deep enough, or the test lies¶
A low overlap means “no partner here”, never “no partner”. With curves only
to Ry₁₁, eight genuine Ry₁₂–Ry₁₆ states scored 0.02–0.09 and looked
spurious. The Rydberg series accumulates at each threshold, so any finite basis
runs out eventually.
Separating “spurious” from “its partner was never built” needs a physical argument rather than a threshold, and it is the closed-channel energy constraint: a Rydberg series is attached to a closed channel, so only thresholds above a state contribute, and each contributes exactly one index via
At fixed energy a higher vibrational level needs a larger binding and therefore
a lower Rydberg index. The admissible set is finite and computable, so a
basis can be checked for covering it — which turns a judgement call into an
arithmetic one (qscat.core.bo.admissible_levels / basis_covers).
That distinction was nearly missed twice. Besides the eight states above, two poles passed as clean identifications on overlaps of 0.21 and 0.11 simply because nothing competed with them, until the check was widened to fire on any weak match rather than only a vanishing one.
A third of the poles have left the box¶
The overlap cannot see a state that no longer fits its grid, and is not supposed to. The c-product cancels the rotated ECS tail by construction — that is what makes it the correct pairing — so a state with 97 % of its probability outside the unscaled region still pairs at 0.99 with the BO product it genuinely is. The identification is right; the summary is misleading.
real_weight (the fraction of |Ψ|² inside the unscaled region) measures what
the overlap cannot. Across window 0 it collapses as the Rydberg series climbs:
level |
|
|
|
|
|
|
|---|---|---|---|---|---|---|
overlap |
0.990 |
0.990 |
0.990 |
0.987 |
0.966 |
0.683 |
|
0.682 |
0.286 |
0.116 |
0.031 |
0.008 |
0.010 |
Those orbitals (n_eff ≈ 12–17, ⟨r⟩ ~ n²) are simply larger than the 300-bohr
box. 18 of the 57 poles are box-limited on a 0.5 threshold, and nothing
about them is quotable — not their shift, not their width. They are reported,
not deleted: the identification stands, and a larger box is what would settle
them.
This was not caught until real_weight was added, and it moved every statistic
computed over the surviving population. What follows is the corrected version.
The BO error sorts by regime¶
Over the 24 quotable pairs, median |shift|:
regime |
levels |
median |shift| |
max |
|---|---|---|---|
high- |
18 |
0.457 meV |
2.860 |
compact low- |
6 |
3.702 meV |
15.586 |
An eightfold separation. A distant Rydberg electron follows the nuclei
adiabatically, so its level is nearly BO-exact; a compact one overlapping the
dissociative channel does not. Both regimes exceed N₂’s 0.22 meV
(exact-2d-resonances.md) and neither is one-signed.
The overlap shows the same ordering on an independent measure — high-n states
score 0.83–0.99 against low-n’s 0.71–0.88 — though the two bands now overlap,
where the earlier (contaminated) population separated them cleanly at 0.96–0.99
versus 0.63–0.88. The purity claim was partly carried by the box-limited states;
the shift claim survives on its own.
The largest clean shifts:
E (Ha) |
level |
overlap |
shift (meV) |
|---|---|---|---|
0.014026 |
\(\omega_4^3\) |
0.722 |
+15.586 |
0.012162 |
\(\omega_6^2\) |
0.706 |
−4.778 |
0.006316 |
\(\omega_5^2\) |
0.870 |
+3.809 |
0.005661 |
\(\omega_3^3\) |
0.783 |
+3.596 |
0.003924 |
\(\omega_2^4\) |
0.878 |
−3.154 |
0.012686 |
\(\omega_2^7\) |
0.828 |
+2.860 |
No shift is quoted for a blended state. At the \(\omega_5^3\)/\(\omega_4^4\) crossing (both
poles) and at \(\omega_6^2\)/\(\omega_3^4\), the exact state is a near-equal mixture of two BO
levels (overlaps 0.63–0.68 against 0.55–0.63). That is a stronger statement than
a large shift: past a certain coupling the BO labels stop describing the state
at all, and “displacement from level X” has no referent. The \(\omega_1^{16}\)/\(\omega_2^5\)
crossing reported earlier is now box-limited instead — those two poles sit at
real_weight 0.010 and 0.004, so the blend was being measured on states the
grid does not hold.
The states themselves¶
The shift table says how far; the wavefunctions say what of. All four panels
show R horizontally, r vertically increasing downward, complex phase as hue
and magnitude as brightness, with the state’s own classical turning surface
overlaid.
A near-degeneracy split asymmetrically¶
At E ≈ 0.0055 Ha two BO levels sit 20 µHa (0.5 meV) apart — \(\omega_1^9\) (Ry₉,
v=1) and \(\omega_3^3\) (Ry₃, v=3) — and the exact solver returns two poles
154 µHa (4.2 meV) apart. The near-degeneracy is split about eightfold, and
asymmetrically: \(\omega_1^9\) moves −0.04 meV while \(\omega_3^3\) moves +3.60 meV.
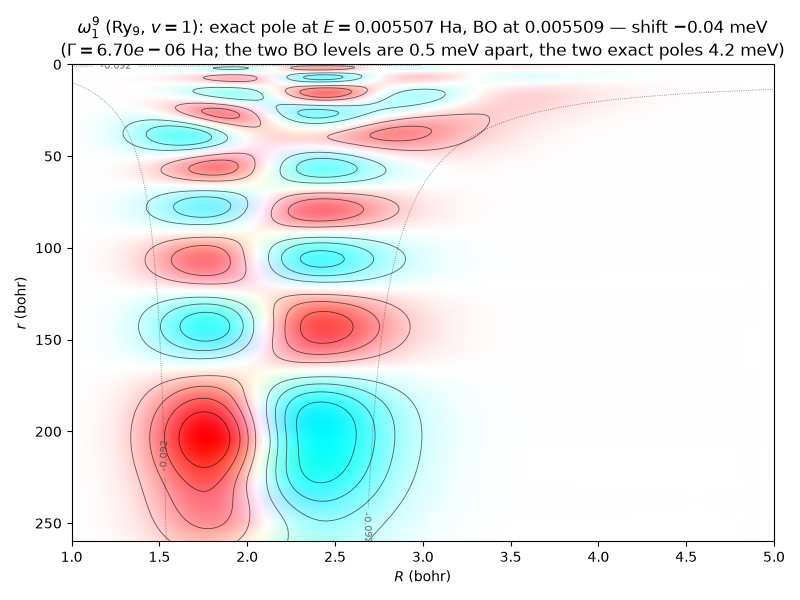
\(\omega_1^9\) (Ry₉, v=1): diffuse, ~9 radial lobes reaching past 250 bohr, one node
in R. Overlap with its BO product 0.970 — nearly pure, and it barely moves.
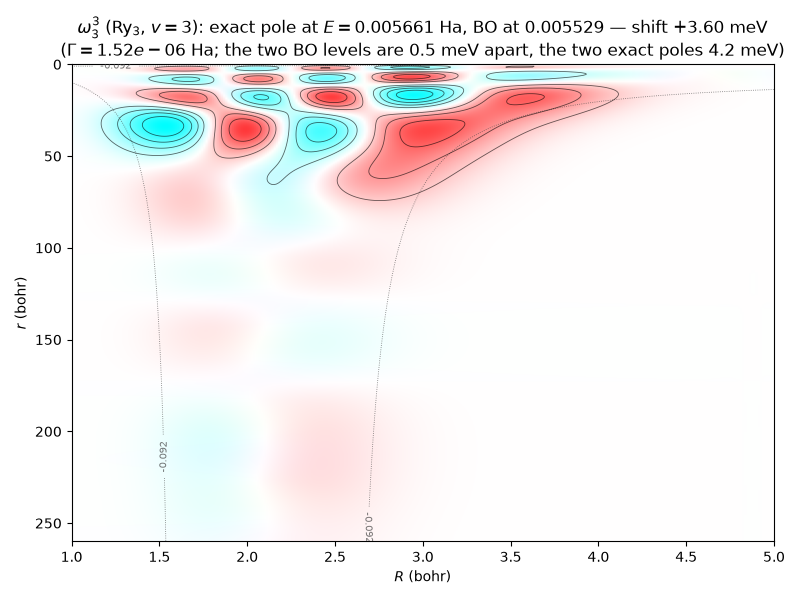
\(\omega_3^3\) (Ry₃, v=3): compact, confined inside ~70 bohr, three nodes in R.
Overlap 0.783 — strongly mixed, and it carries almost the whole 4.2 meV
splitting.
The node counts confirm the assignment independently of the overlap: the two states differ in both Rydberg index and vibrational quantum number, so they differ in node count in both coordinates, and there is no way to swap the labels without contradicting the pictures.
What a shift is made of¶
The pair above localises the effect between two states. This pair localises it inside one: the same pole drawn beside the BO product it is supposed to be.
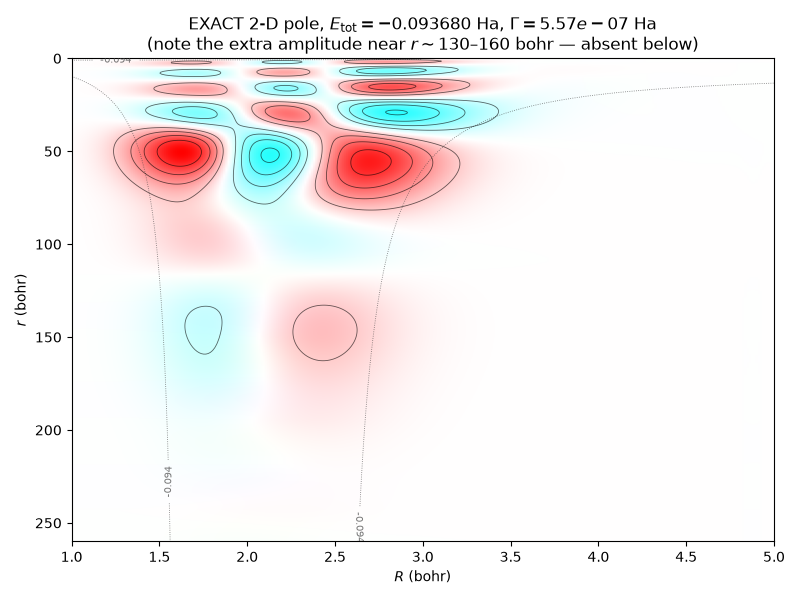
The exact 2-D pole at E_tot = −0.093680 Ha (E ≈ 0.0039 Ha), Γ = 5.6 × 10⁻⁷ Ha.
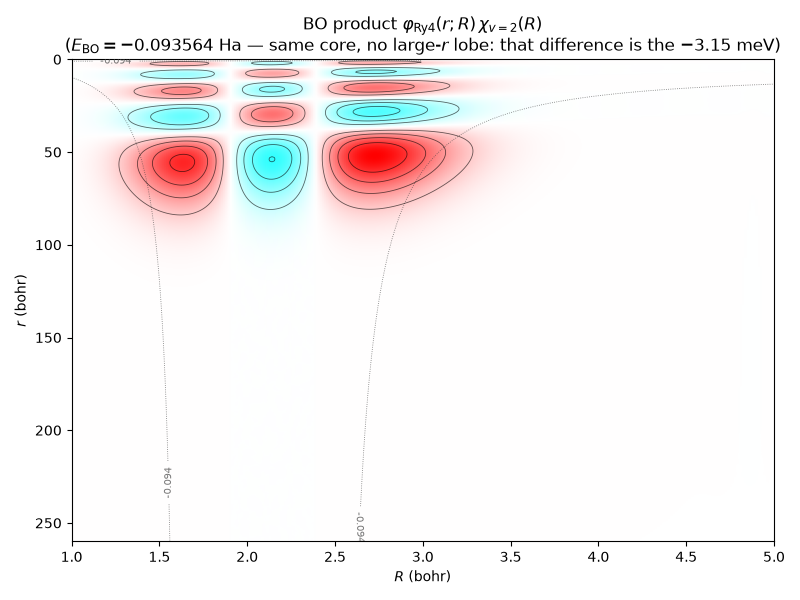
The BO product \(\phi_{\mathrm{Ry}_4}(r;R)\cdot\chi_{v=2}(R)\) at E_BO = −0.093564 Ha — the state the
approximation asserts the one above is.
They share a core: five radial lobes, two nodes in R, the same turning
surface. The difference is the extra amplitude the exact state carries near
r ≈ 130–160 bohr, which the product has nowhere to put — the electronic factor
is a single Ry₄ orbital at every R, and it cannot grow a lobe out there
without changing curve. That admixture is what the −3.15 meV is made of.
Reduced mass¶
The levels and poles in the figures are computed at REFERENCE_MU = 918.25, the
value the σ_DR sweep was computed with, so that marks and curves are on the same
footing: a level and a peak separated by the ~2 × 10⁻⁶ Ha the mass correction is
worth would be ~10 % of a resonance width and could be misread as a shift.
This repository’s shipped H2P.mu is the corrected 918.076 (Váňa 2017
Tab. 1.2; Hvizdoš 2016 Tab. 1.1; Hvizdoš et al. 2018 §II A all give m_p/2,
which the eMoScat deck contradicts). Every figure caption says which mass
produced it, and the full sweep is to be recomputed at the corrected value.
That the residual is the mass constant was measured, not assumed: against the
published \(\omega_i^j\) table all 53 levels agree to ≤ 4 × 10⁻⁶ Ha, and substituting
918.25 for 918.076 drops the mean difference to 1.1 × 10⁻⁷ Ha, a 23×
improvement. At matched constants this implementation reproduces the published
levels to ~10⁻⁷ Ha (validation/h2plus/reference_levels.py, gated).
What is established, and what is not¶
claim |
status |
|---|---|
exact poles land on the published peaks, 0.2–0.3 widths, all three windows |
measured against data the poles were not fitted to |
4 of 57 angle-stable poles are not resonances |
overlaps 6e-4…7e-3 against a basis proven complete at those energies |
the BO shift splits by regime, 0.457 vs 3.702 meV median |
24 quotable pairs; the overlap orders the same way but its bands now touch |
18 of 57 poles are |
the high- |
pole POSITIONS are box-converged |
|
the pole COUNT is not converged |
18→22, 13→10, 14→13 across the three windows — and not even monotone |
per-level shifts for the 6 |
not quoted — their partner is outside the basis |
σ_DR near a threshold |
wrong, 100–700× too large — see |
The box-convergence claim carries a qualification, and real_weight sharpens it
into a warning. electronic_box keeps the inner segments fixed and lays the
outer region out in 10-bohr elements regardless of r_max, so 100–300 bohr is
discretized identically in both runs and the extension only appends elements
beyond 300. The physical content is therefore “these states have no support past
300 bohr”, not a general claim that any two boxes agree to 10⁻⁹.
For 18 of the poles that premise is false — they have most of their support past 300 bohr. The 300-vs-600 comparison was run on the earlier 3-seed campaign, which never contained them, so the states where box size matters most are exactly the ones it did not test. Repeating it at full seeding is the open item.
The pole at the top of each window carries the largest electronic angle residual (up to 5 × 10⁻⁸) and is the least trustworthy of the set.
Reproducing¶
uv run python -m validation.h2plus.exact_poles        # the pole campaign
uv run python -m validation.h2plus.bo_overlap         # the overlap verdicts
uv run python -m validation.h2plus.dr_levels_figure   # the σ_DR figure
uv run python -m validation.h2plus.resonance_state_figures   # the four states
Each window is a ~10–30 minute multi-shift 2-D solve, cached to a git-ignored
.npz; delete the cache to recompute. The BO basis is one pass of dense
electronic eigensolves over the nuclear grid, shared across every (curve, vib)
pair.
The machinery is library code — qscat.core.bo builds the reference states,
qscat.core.assignment pairs and judges them, qscat.core.ecs_angle_family
builds the two-angle grid family. What lives under validation/h2plus/ is the
campaign: which curves, which windows, which seeds.